
Accounts Receivable Aging Analysis: A Practical Guide
Last updated:
Accounts receivable aging analysis helps finance teams evaluate unpaid customer invoices, identify overdue exposure, and decide which balances require collection follow-up, dispute resolution, or credit review. A large receivables balance does not necessarily mean cash will arrive on time. Its aging distribution shows whether invoices remain within agreed payment terms or are becoming increasingly overdue. This practical guide explains how to calculate aging buckets, measure overdue exposure, interpret customer payment patterns, and turn an AR aging report into a clear collection action plan.
What Is Accounts Receivable Aging Analysis?
Accounts receivable aging analysis evaluates outstanding customer balances by grouping them into age categories and interpreting the resulting payment patterns, overdue exposure, and collection risks.
Reports may age invoices from either the invoice date or the contractual due date, depending on their purpose. This guide uses the due-date basis to distinguish invoices that remain within payment terms from those that are overdue.
The aging buckets used throughout this guide are Current, 1–30, 31–60, 61–90, and Over 90 days past due.
The analysis becomes valuable when those balances are interpreted for action. It helps finance teams identify overdue exposure, spot payment risk, prioritize collection efforts, and estimate doubtful accounts. More importantly, it shows whether reported receivables are likely to convert into cash on time or remain tied up in aging balances.

How to Calculate Accounts Receivable Aging
Before calculating aging, confirm that the report uses a consistent reporting date and reliable open-item data. Check contractual due dates, apply payments and credit notes recorded through the reporting cutoff, and investigate unapplied cash that may affect customer balances.
Reconcile the AR subledger with the corresponding general ledger balance and document any reconciling items. For partially paid invoices, age only the remaining outstanding amount.
Then calculate days past due for each open invoice and assign its remaining balance to the appropriate aging bucket.
In simple terms:
Open invoice → Due date → Days past due → Aging bucket → AR aging report
AR aging and Days Sales Outstanding (DSO) answer different questions. Aging identifies which invoices remain unpaid and how overdue they are, while DSO provides a portfolio-level measure of the time taken to convert sales into cash. Read them together, but use invoice-level due dates to calculate days past due.
Calculate Days Past Due From the Invoice Due Date
For overdue analysis, the key reference point is the invoice due date, not simply the date the invoice was issued.
Days Past Due = Reporting Date – Invoice Due Date
For example, an invoice issued on September 1 with Net 30 terms is due on October 1. If the aging report is prepared on October 15, the invoice is 14 days past due. If the reporting date falls on or before the due date, the invoice remains Current.
Using the due date prevents customers with different contractual payment terms, such as Net 30 or Net 60, from being classified incorrectly.
Assign Receivables to Aging Buckets
Once days past due are calculated, each open balance is placed into an aging bucket. A common structure is:
| Aging bucket | What it shows |
| Current | Payment is not yet due |
| 1–30 days past due | Recently overdue; initial follow-up may be required |
| 31–60 days past due | Payment delay is becoming more significant |
| 61–90 days past due | Requires closer collection and risk review |
| Over 90 days past due | Requires investigation, escalation, or further credit assessment |
Keeping Current separate from 1–30 days past due is important. An invoice that is still within agreed payment terms should not be treated the same as an invoice that has already missed its due date.
Aging buckets can also be adjusted to fit a company’s credit policy, customer base, or reporting needs.
Example of an Accounts Receivable Aging Calculation
Assume an AR aging report is prepared as of December 31, 2026. Payments and credits recorded through that date have already been applied.
| Customer | Invoice | Remaining Open Balance | Due Date | Days Past Due | Aging Bucket |
|---|---|---|---|---|---|
| Alpha Corp | INV-001 | $10,000 | Dec 20, 2026 | 11 | 1–30 days past due |
| Beta Inc | INV-002 | $25,000 | Nov 15, 2026 | 46 | 31–60 days past due |
| Gamma LLC | INV-003 | $5,000 | Sep 15, 2026 | 107 | Over 90 days past due |
| Delta Ltd | INV-004 | $15,000 | Jan 15, 2027 | Not yet due | Current |
| Epsilon Co | INV-005 | $5,000 | Dec 31, 2026 | 0 | Current |
| Total | $60,000 |
Epsilon’s invoice originally totaled $8,000, but a $3,000 payment was applied before the reporting cutoff. Only the remaining $5,000 appears in the aging report. Because payment is due on the reporting date, the balance is Current rather than overdue.
The report therefore shows $20,000 Current, $10,000 in 1–30 days, $25,000 in 31–60 days, and $5,000 Over 90 days past due. These amounts establish the aging distribution; the next step is to assess exposure and determine appropriate actions.
How to Read an AR Aging Report
Accounts receivable aging analysis starts with reading the AR aging report in layers rather than focusing on a single total. Begin with total accounts receivable, then examine how that balance is distributed across Current, 1–30, 31–60, 61–90, and 90+ day buckets. This shows how much of the portfolio remains within normal payment terms and how much has already moved into overdue status.

Consider two companies with the same $1 million in accounts receivable:
| Aging bucket | Company A | Company B |
| Current | $800,000 | $100,000 |
| 1–30 days past due | $100,000 | $100,000 |
| 31–60 days | $100,000 | $0 |
| 61–90 days | $0 | $300,000 |
| Over 90 days past due | $0 | $500,000 |
| Total AR | $1,000,000 | $1,000,000 |
Both companies report $1 million in AR, but their overdue exposure differs substantially. Company A has $200,000 overdue, representing 20% of total AR. Company B has $900,000 overdue, representing 90%.
Company B also has $800,000, or 80% of total AR, more than 60 days past due. This warrants closer investigation, although aging alone does not establish how much will ultimately be uncollectible.
Because this report already uses contractual due dates, payment terms are reflected in the bucket assignments. If the distribution looks unexpected, check due-date accuracy and payment application before drawing conclusions.
Read the report in this order: Total AR → Overdue Percentage → Older-Bucket Exposure → Customer-Level Detail.
How to Analyze Accounts Receivable Aging
Reading an aging report shows where receivables sit. Accounts receivable aging analysis goes a step further by explaining what those balances mean for collection risk. A practical review should move through six questions: Age → Exposure → Concentration → Root Cause → Payment Behavior → Trend. This helps finance teams determine which balances require attention, which customers create the greatest exposure, and whether collection risk is improving or deteriorating.
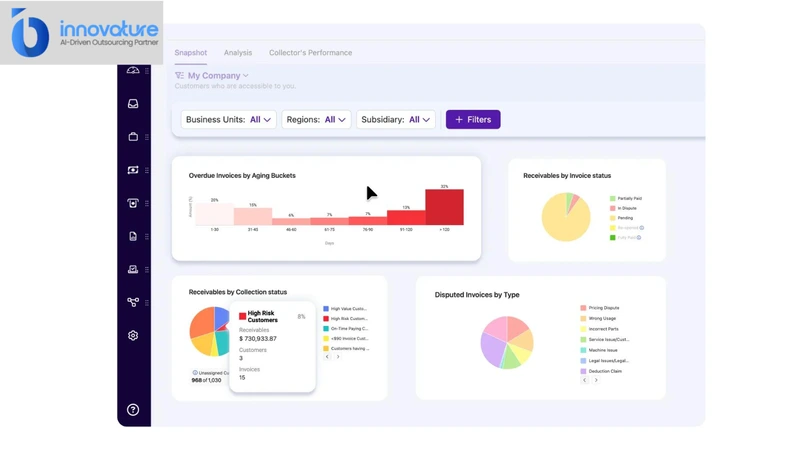
Calculate Overdue Exposure
Start by measuring how much of the receivables portfolio is overdue and how much sits in older buckets.
Overdue AR % = Total Past-Due AR ÷ Total AR × 100
AR Over 60 Days % = AR More Than 60 Days Past Due ÷ Total AR × 100
AR Over 90 Days % = AR More Than 90 Days Past Due ÷ Total AR × 100
Using the earlier comparison, Company B has an overdue percentage of 90%, an over-60-day percentage of 80%, and an over-90-day percentage of 50%.
Track both dollar amounts and percentages. Growing sales can reduce the percentage in older buckets even when the overdue dollar balance has increased. Compare results across consistent reporting periods and investigate changes rather than assuming one percentage represents a universal acceptable level.
Identify Customer Concentration Risk
Start by identifying how much of total and overdue AR is concentrated among individual customers. The same $300,000 overdue balance carries a different risk when it is spread across dozens of accounts versus when $200,000 belongs to one customer.
Customer Concentration % = Customer’s Outstanding AR ÷ Total AR × 100
For example, a customer owing $200,000 within a $1 million AR portfolio represents 20% of total exposure. Calculate that customer’s share of overdue AR separately to understand whether collection risk is concentrated in the same account.
The analysis should therefore combine amount, aging, and customer concentration. Particular attention should be given to customers that represent a significant share of both total AR and the more than 60 days past due or 90+ day balances. The appropriate concentration threshold should reflect the company’s own credit policy and risk tolerance rather than an arbitrary industry percentage.
Separate Disputed Invoices From Credit Risk
An overdue invoice does not automatically indicate that a customer cannot pay. Delays can result from incorrect pricing, missing purchase orders, incomplete supporting documents, delivery issues, billing errors, or slow internal approvals.
Atradius’ 2026 US payment practices research identifies customer liquidity constraints as a major source of late payment, but also points to delivery or service issues, payment-system problems, and slow approval processes.
This distinction matters operationally. Credit-related delays belong in the collection or credit-review workflow, while disputes and process issues should be routed to the teams responsible for resolving the underlying problem.
Identify Chronic Late Payers
A single aging report may show that a customer is late; several consecutive reports reveal whether late payment is a pattern. Finance teams should flag customers that repeatedly move into more than 30 days past due, more than 60 days past due, or older buckets and compare their behavior with agreed payment terms.
Recurring delays may justify a review of credit limits, payment terms, deposit requirements, or collection cadence. However, repeated late payment should be treated as a risk signal rather than proof that a customer is deliberately withholding cash.
Track Receivables Moving Into Older Aging Buckets
Track the same invoices or invoice cohorts across reporting periods to see whether balances are collected, remain unresolved, or move into older aging buckets.
For example, an unpaid invoice that moves from 1–30 to 31–60 days past due requires a different response from one that disappears because payment was received. A reduction caused by a credit note or write-off should also be distinguished from cash collection.
Compare opening overdue balances with payments, credits, write-offs, and newly overdue invoices. This helps explain whether changes reflect collection progress or other movements in the ledger.
Review migration alongside DSO, dispute volumes, and payment commitments. Keep the aging basis and reporting cutoff consistent so comparisons remain meaningful.
How to Prioritize Collections From AR Aging Analysis
Once risks have been identified through accounts receivable aging analysis, the next step is deciding where limited collection resources should be focused. The oldest invoice is not always the highest priority. A more effective overdue receivables analysis weighs six factors together: Age + Amount + Customer Concentration + Payment Behavior + Dispute Status + Credit Risk.
| Priority | Typical AR Profile | Recommended Action |
| Collect now | Large balance, materially overdue, no active dispute, and still considered collectible | Start direct collection follow-up and set a clear payment commitment date |
| Resolve first | Payment is delayed by pricing, documentation, delivery, or another invoice dispute | Route the issue to the responsible team and resolve the root cause before escalating collections |
| Credit review | Customer repeatedly pays late or continues moving into older aging buckets | Review credit terms, credit limits, deposit requirements, and collection cadence |
| Escalate | High-value exposure combined with worsening payment behavior or increasing credit risk | Escalate to finance or credit management for stronger collection action and risk review |
For illustration, assume Beta’s $25,000 balance has no active dispute and the customer remains creditworthy. It may warrant immediate collection follow-up because of its cash impact and overdue status.
If Gamma’s $5,000 balance is held up by a missing delivery document, resolving that issue may be more effective than increasing reminder frequency. Its older age still warrants monitoring, but the next action should address the reason payment is blocked.
These decisions depend on verified account information. Amount and age identify exposure; dispute status, payment behavior, and credit assessment determine the appropriate response.
Adding Owner and Next Action fields to the AR aging report helps turn it from a static finance report into an operational collection tool. Each overdue balance should have a clear person responsible and a defined next step.
The objective is not simply to chase the oldest invoices. Collection priorities should balance recoverability, cash impact, and effort required so finance teams focus first on accounts where action can have the greatest effect on working capital.
How AR Aging Helps Estimate Doubtful Accounts
AR aging can support an allowance estimate by applying appropriate expected-loss rates to receivables grouped by age and relevant risk characteristics.
For a simplified illustration, use the $60,000 aging schedule from the earlier example:
| Aging Bucket | Outstanding Balance | Illustrative Expected-Loss Rate | Estimated Credit Loss |
|---|---|---|---|
| Current | $20,000 | 0.5% | $100 |
| 1–30 days past due | $10,000 | 2% | $200 |
| 31–60 days past due | $25,000 | 5% | $1,250 |
| 61–90 days past due | $0 | 10% | $0 |
| Over 90 days past due | $5,000 | 20% | $1,000 |
| Total | $60,000 | $2,550 |
Estimated Credit Loss for Each Bucket = Outstanding Balance × Expected-Loss Rate
The rates above are hypothetical teaching assumptions, not industry benchmarks or recommended accounting rates. They illustrate how the calculation works.
Actual estimates should consider historical loss experience, customer risk characteristics, current conditions, and any forward-looking information required by the applicable accounting framework. Material accounts may also require separate assessment rather than relying solely on a bucket average.
In this example, $2,550 represents the illustrated required allowance balance. It is not automatically the expense to record for the period; any adjustment must also consider the existing allowance balance and the company’s accounting policy.
Common Mistakes in Receivables Aging Analysis
Even a well-structured AR aging report can lead to poor decisions if the underlying data or interpretation is flawed. Common mistakes include:
- Confusing invoice age with delinquency: An invoice-date aging report shows how long a balance has been outstanding. Use contractual due dates when assessing lateness, and avoid mixing aging bases in the same analysis.
- Looking only at total AR: A healthy total balance can still hide heavy exposure in older buckets.
- Using incorrect contractual due dates: Missing or inaccurate payment terms can place invoices in the wrong buckets and trigger unnecessary collection follow-up.
- Treating every 90+ balance as equal: A 95-day invoice and a 300-day balance may require very different actions.
- Mixing disputes with credit risk: Billing or service issues should not be treated as customer insolvency.
- Ignoring customer concentration: A large overdue balance tied to one customer creates a different risk profile.
- Reviewing only a single snapshot: Without trend analysis, bucket migration can be missed.
- Running reports before cash application or reconciliation: Recent payments may still appear overdue.
- Leaving accounts without an owner or next action: Aging data becomes descriptive rather than operational.
How Finance Outsourcing Can Support AR Aging and Collections
Finance outsourcing can add execution capacity to accounts receivable without transferring every credit decision outside the business. A well-defined outsourcing model keeps credit policy, material exceptions, write-offs, and strategic customer decisions with the internal finance team, while repeatable AR activities are handled through a structured operating process.
For broader finance migrations, a structured finance outsourcing transition plan can help define scope, ownership, controls, and handover steps.
External AR support can cover:
- AR reconciliation: match customer balances, invoices, payments, and unapplied cash.
- Aging report maintenance: keep open-item data current and reconcile balances before reporting.
- Overdue monitoring: identify accounts moving into more than 30 days past due, more than 60 days past due, and 90+ buckets.
- Customer follow-up: maintain a consistent collection cadence and document payment commitments.
- Dispute tracking: separate billing or service issues from genuine credit problems.
- Collection notes and escalation reporting: give finance leaders clear visibility into owner, status, and next action.
Innovature’s AR support includes aging review, reconciliation, collection follow-up, dispute administration, and AR reporting, while clients retain control over credit terms, limits, write-offs, and material customer decisions.
This operating discipline matters as working-capital pressure increases. The Hackett Group’s 2026 North American Working Capital Survey estimates a $1.94 trillion working-capital performance gap among the region’s largest companies and reports deteriorating receivables performance.
For finance teams dealing with growing AR volumes, reconciliation backlogs, or inconsistent collection follow-up, Innovature can provide dedicated Finance & Accounting Outsourcing support while keeping financial control with the client organization. Contact Innovature to discuss how a structured AR support model can improve visibility, strengthen follow-up, and support more consistent accounts receivable operations.
Frequently Asked Questions About Accounts Receivable Aging Analysis
What Are the Standard AR Aging Buckets?
Common due-date-based categories are Current, 1–30, 31–60, 61–90, and Over 90 days past due. Businesses may split older balances into 91–120 and Over 120 days. Define bucket boundaries clearly so each invoice belongs to only one category.
Should AR Aging Be Based on the Invoice Date or Due Date?
Use the contractual due date to assess delinquency and prioritize overdue collection activity. Invoice-date aging can show how long receivables have been outstanding. Both approaches can be useful, but the reporting basis should be clearly identified and applied consistently.
How Often Should an AR Aging Report Be Reviewed?
There is no universal review frequency. Weekly reviews may suit businesses with high transaction volumes or tighter cash requirements, while monthly reviews may be sufficient for more stable portfolios. The key is reviewing often enough to act before balances migrate into older buckets.
What Does a High Over-90-Day AR Balance Mean?
A high 90+ balance means a larger share of receivables has remained unpaid well beyond contractual due dates. It warrants closer investigation, but does not automatically mean bad debt; the cause may be credit deterioration, unresolved disputes, or internal process issues.
How Does AR Aging Help Estimate Bad Debt?
AR aging can support expected-loss estimates by grouping receivables and applying loss rates supported by relevant collection history and risk characteristics. Those assumptions should be assessed against current conditions and the applicable accounting requirements, rather than copied from generic benchmark percentages.


Finance leaders are under pressure to strengthen controls, close faster, improve data quality, and support business decisions without…

Vendor master data controls govern how supplier records are created, verified, approved, changed, and deactivated before they are…

Finance outsourcing governance is a framework that defines roles, decision rights, internal controls, and provider oversight when finance…

Selecting a finance outsourcing provider does not make a finance process ready to move. Before operational ownership changes…

PayrollOrg’s 2025 survey found that 38% of organizations do not track payroll performance, showing that payroll oversight remains…

Payroll accuracy often breaks down before payment is even made. PayrollOrg’s 2025 global survey identified poor-quality input data,…
Intercompany balances become harder to control as businesses add legal entities, currencies, systems, and cross-border transactions. A single…

An accounting quality control checklist helps Controllers and Finance Managers verify whether bookkeeping data is accurate, supported, and…

Month-end close often becomes harder as growing companies process more invoices, payments, reconciliations, and reporting requirements. Without a…

Accounts payable journal entries record what a business owes suppliers and how those obligations change over time. A…

Financial statements analysis is the process of examining a company’s income statement, balance sheet, and cash flow statement…

An offshore accounting strategy defines which finance work should move offshore, how that work will be delivered, who…
Ready to move faster?
Trust us to find the best-fit candidates while you concentrate on building a skilled and diverse remote team.