
The Role of Balance Sheet in Financial Analysis: Why It Matters
Last updated:

Balance Sheet Analysis: How to Evaluate Financial Health
Balance sheet analysis is the process of examining a company’s assets, liabilities, and equity to understand its liquidity, working capital, debt position, financial structure, and ability to support future operations. Rather than looking at individual balances in isolation, Finance compares accounts over time, calculates relevant ratios, investigates unusual movements, and connects those changes with what is happening in the business.
A company can be profitable and still show signs of financial pressure. Accounts Receivable may be rising faster than revenue, cash may be falling, inventory may be building, or short-term borrowing may be increasing. The opposite can also happen: temporary earnings pressure may coexist with strong liquidity and a healthy capital structure.
A useful balance sheet analysis therefore goes beyond asking what the company owns and owes. It asks:
What changed, why did it change, and what does that change mean for the business?
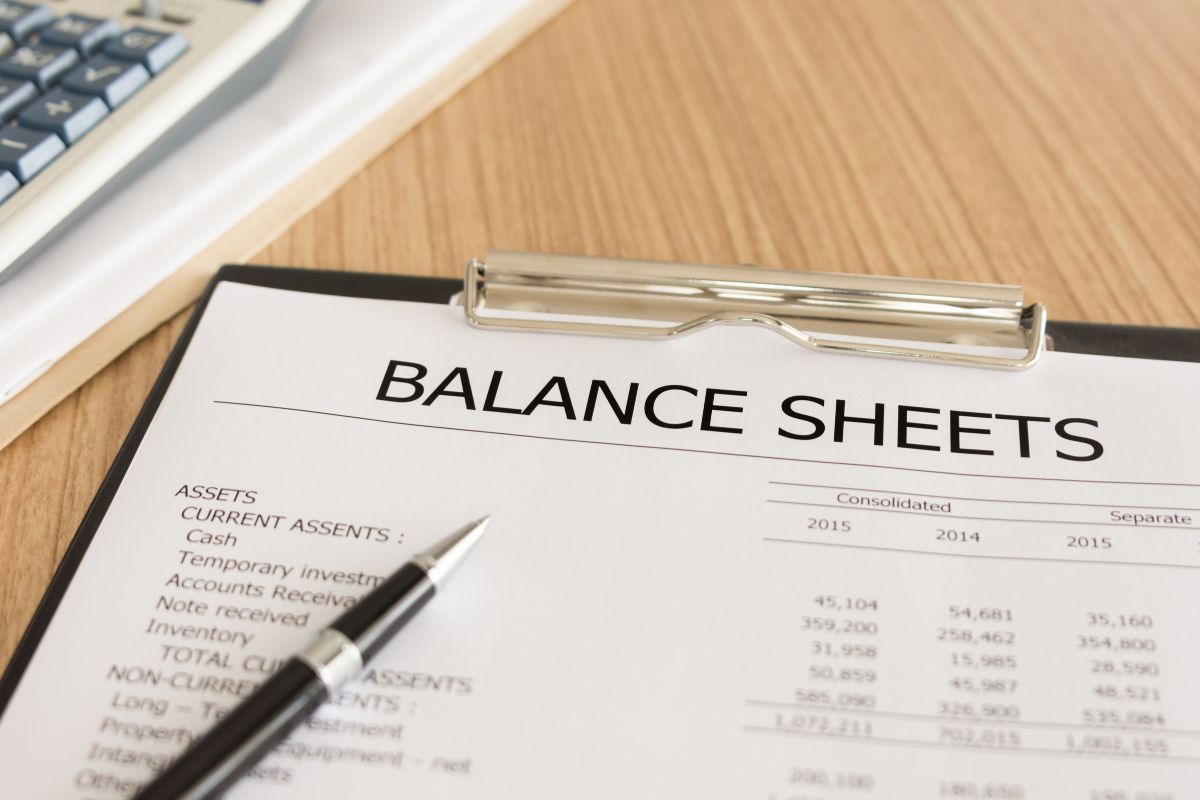
What Does Balance Sheet Analysis Tell You?
A balance sheet reports a company’s financial position at a specific point in time using the accounting equation:
Assets = Liabilities + Equity
Assets represent resources the business controls. Liabilities represent obligations. Equity represents the owners’ residual interest after liabilities are deducted from assets.
The definition is simple. The interpretation is more useful.
Suppose a business reports $2 million in Accounts Receivable. That figure alone does not tell management whether collections are healthy. Finance needs to know whether receivables were $1 million six months ago, whether revenue also doubled, whether customer payment terms changed, and whether cash collection is keeping pace.
The same applies to debt. A higher debt balance may reflect financial stress, or it may be the result of a planned investment that is generating new revenue.
This is why balance sheet analysis should focus on relationships and movement rather than treating individual balances as automatically good or bad.
For the broader discipline, see Financial Analysis.
Start With the Balance Sheet Structure
Before calculating ratios, review the major accounts and identify what has changed materially.
A first-pass review can focus on:
| Area | Questions to Ask |
|---|---|
| Cash | Is cash increasing or declining? |
| Accounts Receivable | Is AR growing faster than revenue? |
| Inventory | Is inventory building faster than sales? |
| Accounts Payable | Are supplier balances increasing unusually quickly? |
| Current liabilities | Are short-term obligations becoming harder to cover? |
| Debt | Has borrowing increased materially? |
| Fixed assets | Is the company investing more heavily? |
| Equity | Are retained earnings strengthening or weakening? |
This initial scan tells Finance where deeper analysis is likely to create value.
For example, if cash has fallen 25%, Accounts Receivable has increased 40%, and short-term debt has risen at the same time, the main question is probably not whether every balance-sheet ratio is within an industry range.
The stronger question is:
Is growth consuming more cash than the business is generating?
That is the type of issue a practical balance sheet analysis should surface.
Analyze Liquidity and Working Capital First

Liquidity is one of the most important areas to review because it indicates whether the business has enough short-term financial capacity to meet near-term obligations.
A basic measure is:
Working Capital = Current Assets − Current Liabilities
Positive working capital generally means current resources exceed current obligations. However, the composition matters.
A company can report substantial working capital while most of its current assets are tied up in overdue receivables or slow-moving inventory. Those assets may be less useful for paying suppliers or payroll than the headline working-capital figure suggests.
Two common liquidity ratios provide additional context:
| Ratio | Formula | What It Helps Assess |
|---|---|---|
| Current Ratio | Current Assets ÷ Current Liabilities | Overall short-term coverage |
| Quick Ratio | Cash + Marketable Securities + AR ÷ Current Liabilities | Liquidity without relying heavily on inventory |
The interpretation still depends on context.
A declining current ratio may indicate weaker liquidity, but it could also result from more efficient use of excess working capital. A very high ratio is not automatically positive either; it may mean cash or assets are sitting idle instead of being deployed productively.
Good balance sheet analysis asks why the ratio moved before deciding what management should do.
Accounts Receivable Can Reveal a Cash Problem Before Profit Does
Accounts Receivable is one of the most useful balance-sheet accounts for connecting reported growth with actual cash conversion.
Consider this example:
| Metric | Previous Year | Current Year |
|---|---|---|
| Revenue | $10.0M | $12.0M |
| Accounts Receivable | $1.4M | $2.5M |
| Cash | $1.8M | $1.2M |
Revenue increased by 20%.
Accounts Receivable increased by almost 79%.
That gap deserves attention.
It does not automatically mean collections are failing. Possible explanations include longer payment terms, a change in customer mix, delayed invoicing, billing disputes, or unusually strong sales near period-end.
But Finance should investigate why receivables are expanding significantly faster than revenue.
This is where balance sheet analysis becomes a management tool rather than an accounting exercise.
The business can move from:
“AR increased.”
to:
“AR is growing much faster than sales, so we need to determine whether the issue sits in billing, payment terms, disputes, or collections.”
For more context on how these balances connect with operating performance, see Income Statement Vs Balance Sheet.
Inventory Can Hide Operational Problems
Inventory is another account where the direction of change matters more than the absolute balance.
An increase in inventory may be entirely reasonable. The business could be preparing for expected demand, entering peak season, launching a new product, or building safety stock.
However, inventory growing much faster than revenue can indicate:
weak demand → poor forecasting → excess purchasing → aging stock → cash tied up in operations
That pattern affects more than accounting.
It can influence:
- Working capital
- Warehouse capacity
- Purchasing decisions
- Discounting
- Obsolescence risk
- Cash requirements
A useful balance sheet analysis should therefore connect inventory changes with sales performance and operating decisions.
The balance sheet identifies the financial symptom.
Operations and Finance together determine the cause.
Review Accounts Payable and Short-Term Obligations
An increasing Accounts Payable balance can also have several interpretations.
It may simply reflect higher purchasing activity as the company grows. It can also indicate that the business is taking longer to pay suppliers because cash is becoming constrained.
Compare AP with:
- Purchasing volume
- Cost of Goods Sold
- Payment terms
- Cash balances
- Supplier aging
- Overdue invoices
Suppose supplier balances increase 60% while purchases increase only 15%. Finance should investigate whether invoices are being paid more slowly, whether AP backlogs are increasing, or whether the company has deliberately changed its payment strategy.
The key is to distinguish intentional working-capital management from uncontrolled payment delay.
That distinction matters operationally because excessive supplier aging can lead to late fees, tighter terms, disputes, or supply disruption.
Assess Debt and Financial Leverage
Debt analysis helps management understand how heavily the business depends on borrowing to fund its assets and operations.
A commonly used measure is:
Debt-to-Equity Ratio = Total Debt ÷ Shareholders’ Equity
Consider:
| Year 1 | Year 2 | |
|---|---|---|
| Total Debt | $3.0M | $5.0M |
| Equity | $6.0M | $6.5M |
| Debt-to-Equity | 0.50 | 0.77 |
Leverage has increased considerably.
But that does not tell management whether the change is positive or negative.
If the additional borrowing funded productive equipment, a new facility, or an acquisition generating attractive returns, the higher leverage may be intentional.
If borrowing increased because customers are paying more slowly and operating cash repeatedly runs short, the same ratio points to a different problem.
This is a core principle of balance sheet analysis:
The ratio shows the financial condition. Business context explains why it exists.
Acceptable leverage also differs significantly across industries, so Finance should avoid applying a universal target without considering the company’s operating model.
What Does Equity Tell Management?
Equity represents the owners’ remaining interest after liabilities are deducted from assets.
For established businesses, retained earnings are often an important component because they reflect profits accumulated within the company over time.
Equity can change because of:
- Net income or loss
- Dividends
- Owner contributions
- Share issuance
- Share repurchases
- Other accounting adjustments
A strengthening equity base can indicate that the company is accumulating financial value.
However, equity should not be interpreted alone.
A business can report rising retained earnings while cash declines because earnings are tied up in Accounts Receivable, inventory, capital expenditure, or debt repayment.
This is another reason why balance sheet analysis should connect individual accounts rather than simply reviewing each section separately.
Key Ratios Used in Balance Sheet Analysis
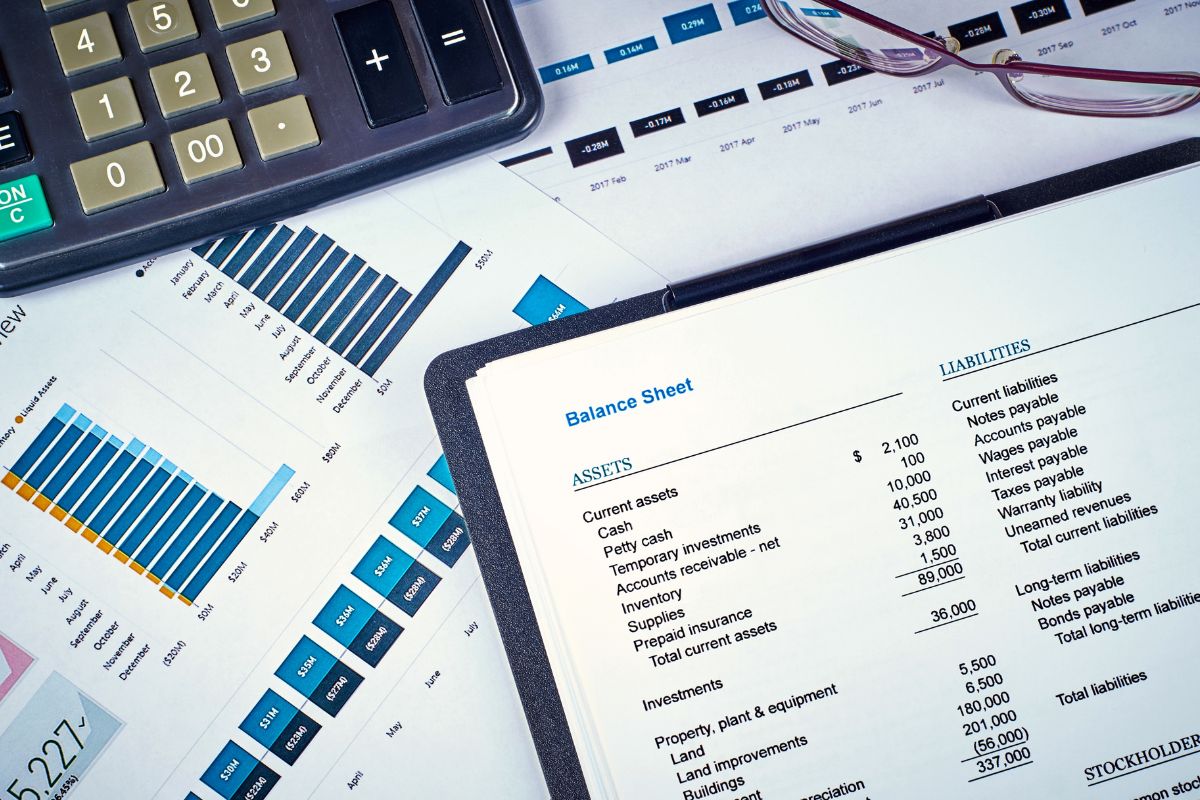
Finance does not need to calculate every available ratio.
The most useful ratios are the ones connected to the company’s actual risks and management questions.
| Analytical Area | Metric | Main Question |
|---|---|---|
| Liquidity | Current Ratio | Can current assets cover current liabilities? |
| Liquidity | Quick Ratio | Can obligations be met without relying on inventory? |
| Working Capital | Net Working Capital | How much short-term financial capacity is available? |
| Leverage | Debt-to-Equity | How dependent is the company on debt? |
| Leverage | Debt-to-Assets | How much of the asset base is debt-funded? |
| Receivables | DSO | How quickly are customers paying? |
| Inventory | Inventory Turnover | How efficiently is inventory moving? |
| Asset Efficiency | Asset Turnover | How effectively are assets generating revenue? |
Some ratios, including DSO, inventory turnover, and asset turnover, combine balance-sheet information with data from the income statement.
That is important because a complete balance sheet analysis rarely operates in isolation.
For a broader framework connecting all three major reports, see Financial Statements Analysis: How to Read the Big Three.
Trend Analysis Matters More Than a Single Snapshot
A balance sheet technically represents one date.
Management usually needs multiple periods to understand whether the financial position is improving or deteriorating.
A practical comparison can include:
current month → prior month → prior quarter → prior year
Consider this example:
| Metric | Q1 | Q2 | Q3 | Q4 |
|---|---|---|---|---|
| Cash | $1.8M | $1.6M | $1.4M | $1.1M |
| Accounts Receivable | $1.5M | $1.7M | $2.0M | $2.4M |
| Inventory | $2.0M | $2.1M | $2.4M | $2.7M |
| Short-Term Debt | $0.8M | $1.0M | $1.3M | $1.7M |
Looking at any one quarter might not trigger concern.
Looking across all four reveals a pattern:
Cash ↓
while
AR ↑ + inventory ↑ + borrowing ↑
That combination suggests working capital may be consuming cash as the year progresses.
Trend-based balance sheet analysis makes relationships like this much easier to identify.
A Practical Balance Sheet Analysis Example
Consider a mid-size business with the following year-over-year results:
| Financial Measure | Previous Year | Current Year | Change |
|---|---|---|---|
| Revenue | $20M | $24M | +20% |
| Cash | $3.0M | $2.1M | -30% |
| Accounts Receivable | $3.2M | $5.0M | +56% |
| Inventory | $4.1M | $5.4M | +32% |
| Accounts Payable | $2.3M | $3.5M | +52% |
| Debt | $4.0M | $6.2M | +55% |
Looking only at revenue, the business appears to be performing well.
But its financial position raises several questions.
Receivables and Accounts Payable are growing far faster than revenue. Inventory is also increasing, while cash is falling and debt is rising.
Management should investigate whether:
- Customers are taking longer to pay
- Billing delays are increasing
- Inventory purchases are running ahead of demand
- Supplier payments are being stretched
- Debt is financing growth or simply covering working-capital pressure
The balance sheet analysis does not provide the final answer.
It identifies where management needs to investigate next.
Red Flags Should Trigger Investigation, Not Automatic Conclusions

Financial signals should rarely be interpreted without context.
| Balance Sheet Signal | Possible Explanations |
|---|---|
| Cash declining | Investment, debt repayment, weak collections |
| AR rising quickly | Strong sales, longer terms, billing or collection issues |
| Inventory increasing | Growth preparation, weak demand, forecasting problems |
| AP increasing | Higher purchases, slower payment, liquidity pressure |
| Debt rising | Expansion investment or operating cash pressure |
| Current ratio declining | Better capital efficiency or weaker liquidity |
| Equity declining | Losses, dividends, repurchases, or adjustments |
The objective of balance sheet analysis is to distinguish normal financial movement from a structural problem.
For example, a 30% increase in inventory may be reasonable before peak season. The same increase after several quarters of declining sales is much more concerning.
Context determines interpretation.
Compare the Balance Sheet With Relevant Benchmarks
Historical trend tells management whether its own financial position is changing.
Benchmarking adds another perspective:
How does the company compare with similar businesses?
Suppose DSO falls from 65 days to 55 days.
Internally, that is an improvement.
But if comparable businesses operate around 40 days, management may still have a material opportunity to improve collections.
Benchmarking can help evaluate:
- Liquidity
- Leverage
- Working capital
- Receivables
- Inventory efficiency
- Asset utilization
The comparison needs to be relevant.
Industry, company size, geography, customer mix, business model, and accounting practices can all influence balance-sheet metrics.
A useful balance sheet analysis therefore combines:
historical trend + relevant benchmark + operating context
rather than assuming every industry average represents an ideal target.
What Balance Sheet Analysis Cannot Tell You
The balance sheet has important limitations.
It represents a single point in time, so period-end balances may not reflect the company’s normal position throughout the year. Some values depend on accounting policies and estimates, while historical carrying values may differ from current economic value.
More importantly, a balance sheet does not show profitability or cash movement on its own.
A company could have a healthy balance sheet today while revenue and margins are deteriorating. Another could report strong accounting profit while cash conversion becomes weaker.
The U.S. Securities and Exchange Commission explains financial statements as a connected set that includes the balance sheet, income statement, cash flow statement, and statement of shareholders’ equity.
A reliable financial assessment should eventually consider all of them together.
Turn Balance Sheet Findings Into Management Questions
The value of analysis appears when financial observations lead to business decisions.
| Finding | Management Question |
|---|---|
| AR rising faster than revenue | Is billing or collections slowing down? |
| Inventory rising faster than sales | Is purchasing aligned with demand? |
| Cash declining | Where is liquidity being absorbed? |
| AP increasing sharply | Are suppliers being paid later? |
| Debt increasing | What is the additional borrowing funding? |
| Current ratio weakening | Is short-term liquidity sufficient? |
| Equity declining | Are losses or distributions reducing resilience? |
| Fixed assets rising | Is new investment generating adequate returns? |
Instead of reporting:
“Accounts Receivable increased by 35%.”
Finance can provide a more useful interpretation:
“Accounts Receivable grew significantly faster than revenue, primarily because billing disputes and extended customer terms increased during the quarter. Improving invoice resolution may therefore have more impact on cash than increasing collection activity alone.”
That is how balance sheet analysis moves from financial reporting to decision support.
Reliable Analysis Requires Reliable Accounting Data
Financial ratios cannot compensate for poor underlying accounting records.
Before management relies heavily on balance sheet analysis, Finance should have reasonable confidence that major accounts are complete and reconciled.
Common issues that can distort the balance sheet include:
- Unreconciled bank accounts
- Unapplied customer payments
- Missing supplier invoices
- Incorrect accruals
- Intercompany differences
- Outdated fixed-asset records
- Misclassified current and long-term balances
For growing companies, the constraint is sometimes operational capacity rather than analytical capability. Finance leaders know what they want to analyze, but recurring AP, AR, reconciliation, journal, and close work consumes much of the available team capacity.
External finance support can help with those execution layers while internal Finance retains responsibility for accounting judgment, interpretation, and management decisions.
Businesses that need additional accounting capacity can explore Innovature Finance & Accounting Outsourcing Services.
Balance Sheet Analysis Review

Before making a management decision based on the balance sheet, confirm the following:
| Area | What to Review |
|---|---|
| Reporting period | Are comparable dates being used? |
| Data quality | Are major accounts reconciled? |
| Cash | What explains the movement? |
| Receivables | Is AR changing consistently with revenue? |
| Inventory | Is inventory growth aligned with demand? |
| Payables | Are supplier obligations increasing unusually quickly? |
| Debt | What is additional borrowing funding? |
| Liquidity | Can short-term obligations be met? |
| Equity | Is the capital base strengthening or weakening? |
| Trends | Is the movement temporary or persistent? |
| Benchmarks | How does the company compare with relevant peers? |
| Root cause | Do we understand why the movement occurred? |
The strongest balance sheet analysis does not simply label ratios as healthy or unhealthy. It helps Finance identify where cash is being absorbed, where financial risk is increasing, where operational processes may be weakening, and which issues deserve management attention.
The balance sheet gives the company a snapshot.
Analysis turns that snapshot into a decision tool.


Vendor master data controls govern how supplier records are created, verified, approved, changed, and deactivated before they are…

Accounts receivable aging analysis helps finance teams evaluate unpaid customer invoices, identify overdue exposure, and decide which balances…

Finance outsourcing governance is a framework that defines roles, decision rights, internal controls, and provider oversight when finance…
Selecting a finance outsourcing provider does not make a finance process ready to move. Before operational ownership changes…

PayrollOrg’s 2025 survey found that 38% of organizations do not track payroll performance, showing that payroll oversight remains…
Payroll accuracy often breaks down before payment is even made. PayrollOrg’s 2025 global survey identified poor-quality input data,…
Intercompany balances become harder to control as businesses add legal entities, currencies, systems, and cross-border transactions. A single…

An accounting quality control checklist helps Controllers and Finance Managers verify whether bookkeeping data is accurate, supported, and…

Month-end close often becomes harder as growing companies process more invoices, payments, reconciliations, and reporting requirements. Without a…

Accounts payable journal entries record what a business owes suppliers and how those obligations change over time. A…

Financial statements analysis is the process of examining a company’s income statement, balance sheet, and cash flow statement…

An offshore accounting strategy defines which finance work should move offshore, how that work will be delivered, who…
Ready to move faster?
Trust us to find the best-fit candidates while you concentrate on building a skilled and diverse remote team.